Every site, camera, and alert on one screen
Existing security cameras become live data: occupancy, restricted zones, alerts, and vehicle locations across a whole network.
The problem
Why this work is slow today.
Most camera systems record and wait. Someone reviews footage after an incident. Across many sites, nobody can watch every feed, so the cameras show what happened and never what is happening.
In the demo
What you see, step by step.
One view of the network
Regions, cities, and branches roll up their cameras, people in view, and alerts.
A live operations view
Occupancy, flow in and out, active alerts, and the busiest spot, with every person boxed and tracked.
Rules that raise alerts
A person entering a restricted zone raises a critical alert. Loitering raises a warning. Each alert is logged with its frame.
Vehicles and questions
The same network tracks vehicles on a map. An assistant answers questions from the system's own live data.
The result
What changes for your team.
Security and operations teams work from one screen for every site. Alerts arrive with the evidence attached, and a person acknowledges, resolves, or dismisses each one. On-premises, the footage stays inside your building.
Who it fits
Multi-site operators
Lab networks, hospital groups, factories, and retail chains.
Security directors
Leaders who need live awareness, not recorded footage.
Facilities teams
Managers who track occupancy and restricted areas.
Transcript
The narration, in full.
This is FinBlade AI's computer vision running across a whole network, 5 regions, 16 cities, and 20 branches, refreshing every 5 seconds. Everything is organized as region, then city, then branch, and each row rolls up its own cameras, people in view, and alerts. Expanding a city shows its branches, each tagged by type, collection centers, laboratories, and the head office, with one-click links to its dashboard and history.
Adding a site is just as simple: create a region, a city, or a branch, then register a camera under that branch, and it joins automatically. The scope filter works the same way, every region at once, one city, or a single branch, and the whole dashboard follows. The map puts the network on one screen, every branch and every vehicle with its camera and alert status.
Tap a branch and the map flies to it. One click opens the live operations view: occupancy, people in the building with the flow in and out per minute, active alerts, cameras online and the busiest spot right now. Below are the live feeds, every person boxed and tracked, with a card for each zone. Most read normal, but the first floor elevator is restricted and someone just walked in, so the card flips to intrusion.
A critical alert lands at the same moment, ready to acknowledge, resolve, or dismiss. Loitering is caught too. Anyone staying over 30 seconds raises a warning. Every alert is logged with its time, rule, severity, zone, and camera. Click view frame and there's the exact moment. Boxed in red inside the restricted area. The same network tracks vehicles.
The fleet page lists every tracker with its last report, speed, battery, and branch, and a new one is registered in a single form. On the map, positions stream in live, with no refresh, so you see whether a vehicle is moving or held up in traffic. Each branch has a geofence, so arrivals are logged on their own. Instead of clicking through any of this, you can simply ask.
Ask AI answers from the system's own live data. Are all cameras online? Did anyone enter the restricted zone? It replies in plain language, says where each number came from, and returns the incident snapshots right in the chat on secure links that expire within the hour. Every branch, every camera, and every vehicle in one platform.
Whether that's a lab network, a hospital group, a factory, or a retail chain.
This demo is produced by ICS Nett and shows FinBlade AI running on sample data. Company names, people, and figures are illustrative. Your deployment runs on your own data, inside your own boundary.
Keep watching
Related demos.
 2:57
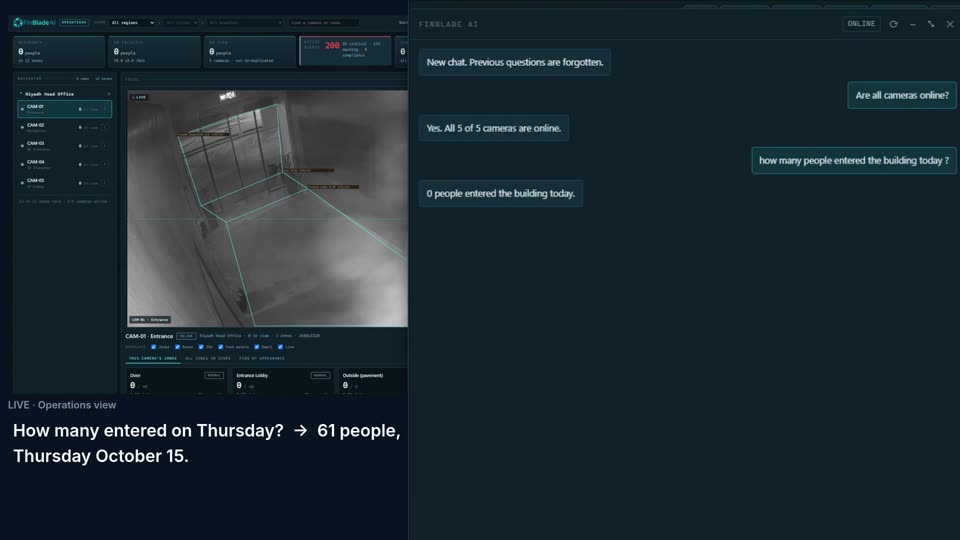
Computer visionAsk your cameras a questionPlain-language questions return counts, open alerts, and evidence snapshots. Results are candidates for review, and a person makes the final call.
 1:36
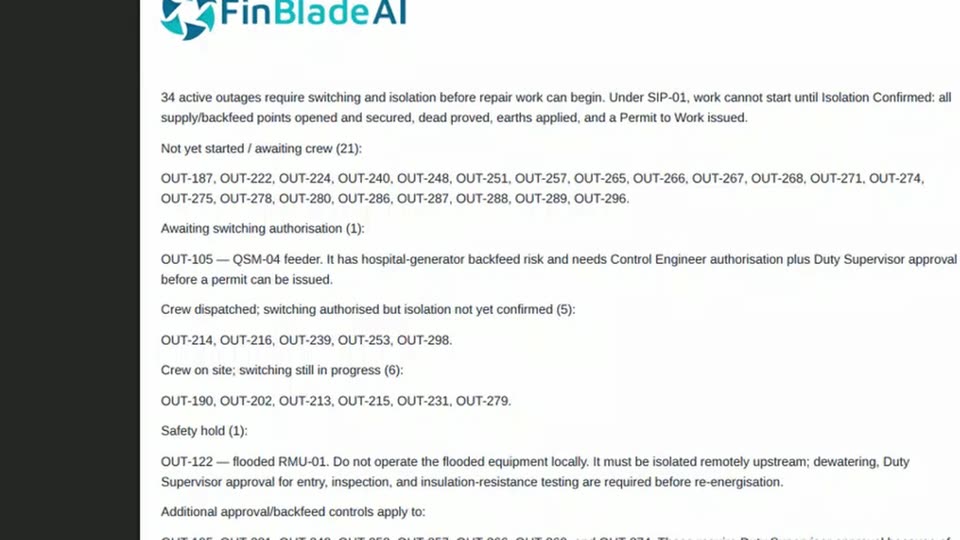
Energy and utilitiesOutage work sorted and crews briefedOne query sorts active outages by what each is waiting on, then sends the dispatch report to the right people.
 1:25
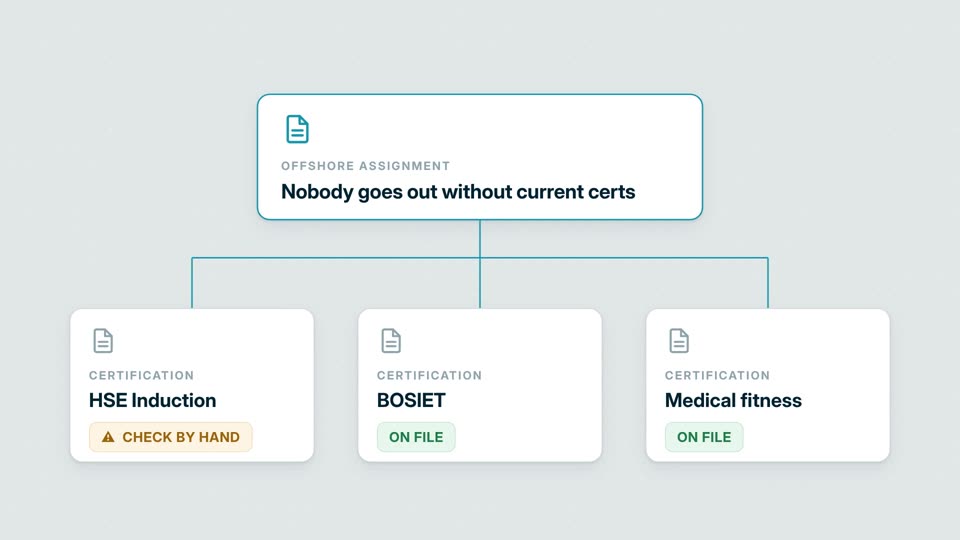
Industrial safetyWho is cleared to work, with the evidenceTraining, permits, and medical certificates are checked together. The answer is dated, and the right report goes out.
Your AI. Your data. Your control.
Want this on your own data?
Start with a free call with Thomas. We map the work, the data rules, and the right deployment path.
Free. Direct. No pitch deck. Rooted in Middle Tennessee, serving organizations nationwide.