A full dashboard from one prompt
Describe the view you need. The platform builds charts and a live dashboard from your own data.
The problem
Why this work is slow today.
Most managers wait on someone else for a report. The request goes in a queue, the chart comes back a week later, and the follow-up question starts the wait again.
In the demo
What you see, step by step.
Connect one data source
The demo uses store performance data for a ten-store retail chain, month by month.
Ask for a chart in plain language
One prompt charts monthly net sales. Another ranks stores. Another breaks sales down by category.
Change it with another prompt
The store ranking becomes a horizontal bar chart, colored by store format, in one request.
Build the dashboard
Pages land on a board as live charts that can be moved, resized, refreshed, and filtered by period.
The result
What changes for your team.
The person with the question becomes the person who builds the view. When there is no specific question, one prompt asks for an overall summary, and the platform builds a complete performance dashboard from the data.
Who it fits
Multi-location operators
Retail, branch, and franchise businesses that compare sites every week.
Finance and FP&A
Teams that answer the same reporting requests again and again.
Executives
Leaders who want to ask their own follow-up questions.
Transcript
The narration, in full.
This is Studio AI. Describe what you need, and it builds it as a live page, a dashboard, a report, or a tracker. Here, it's connected to Rafif Markets' store performance data. 10 stores across Saudi Arabia, month by month. Each page starts from one plain language prompt. This one charts monthly net sales across the year, with the Ramadan peak in March standing out.
From the same source, another page ranks every store by 3rd quarter sales, with Al-Rawda and Al-Olaya in the lead. Another breaks those sales down by category, from grocery and staples to fresh produce. And another tracks online share for the 3 Riyadh stores, climbing after the 30-minute delivery launch. One source can feed as many pages and charts as you need, with no limit to what you can build from it.
Changing a chart is just another prompt. Here, the store ranking becomes a horizontal bar chart, colored by store format. Hypermarkets, supermarkets, and the Express Store now stand apart at a glance. Any page can be added to a board. Here, a new retail sales dashboard is created on the spot. Pages land on the dashboard as live charts that can be moved, resized, and refreshed.
The online share chart joins it, and more can be added at any time, building the retail view piece by piece. When there's no specific question to answer, one prompt is enough: provide an overall graphical summary. Studio AI builds a complete performance dashboard from the data. covering sales and transactions, with sales against target and the category mix.
Every view can be filtered by period, from year-to-date to the full 12 months. Switch the period, and every figure and chart updates with it, from the last 90 days to the full history. A fully comprehensive dashboard from a single prompt.
This demo is produced by ICS Nett and shows FinBlade AI running on sample data. Company names, people, and figures are illustrative. Your deployment runs on your own data, inside your own boundary.
Keep watching
Related demos.
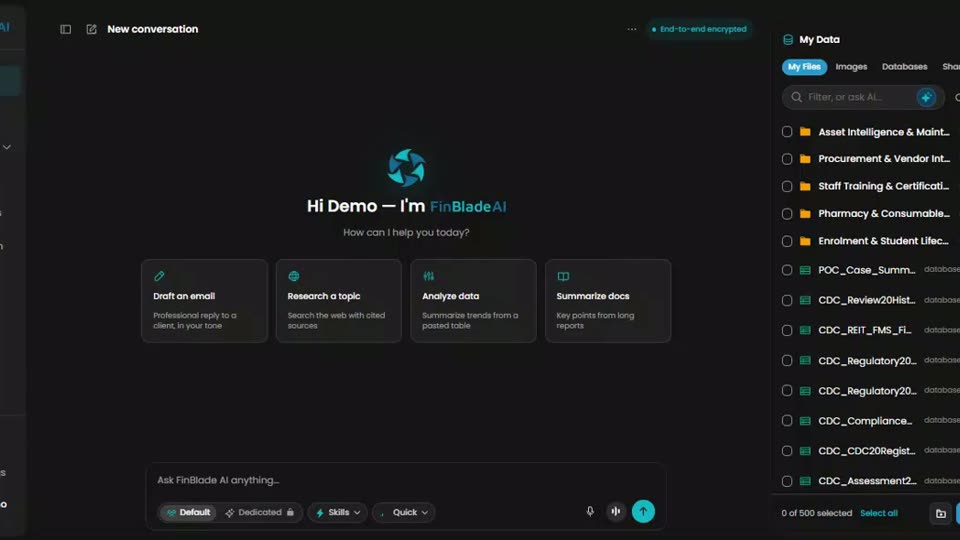 1:38
Platform tourThe whole platform in 98 secondsOne secure workspace to chat with your data, automate your work, and launch AI apps. This is the fastest way to see how the parts fit.
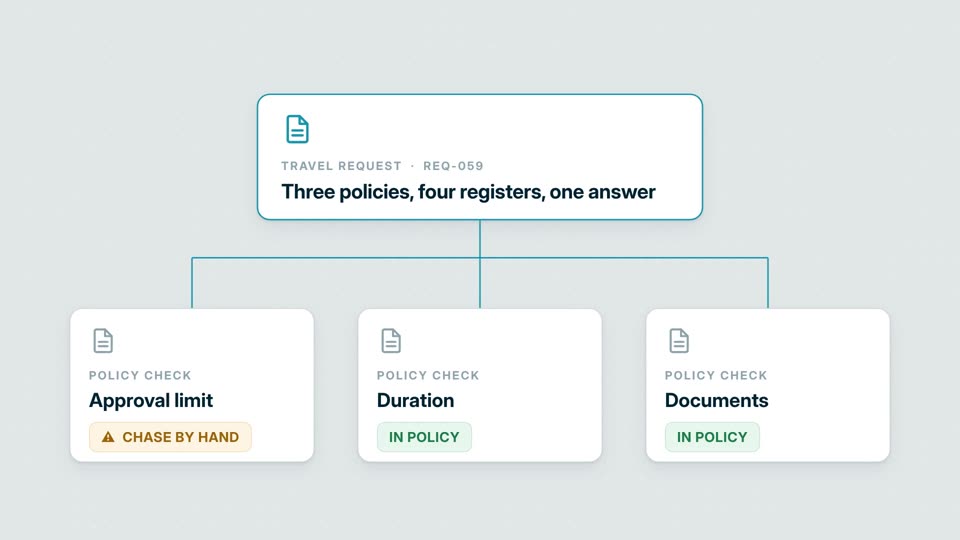 1:27
OperationsThree policies, four registers, one answerCan this request be approved? The workflow checks policy and authority, finds the missing document, and routes the exception.
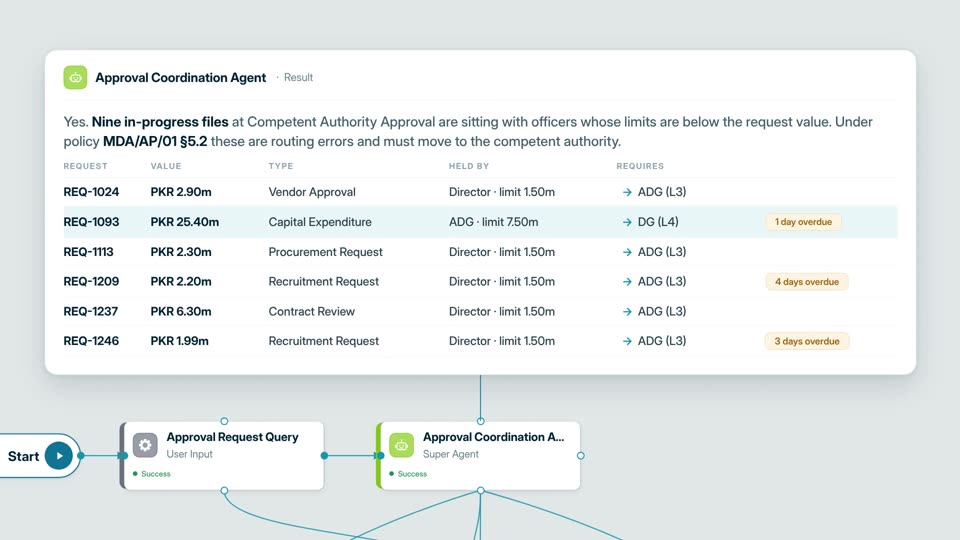 1:42
OperationsApprovals routed to the desk that can signThe agent finds files held by officers without the authority to approve them, then escalates each one with the paperwork.
Your AI. Your data. Your control.
Want this on your own data?
Start with a free call with Thomas. We map the work, the data rules, and the right deployment path.
Free. Direct. No pitch deck. Rooted in Middle Tennessee, serving organizations nationwide.